
When you have a business, one of your top objectives should be growth- exponential or otherwise. To achieve this objective you will need an insight into your customer’s mind, but because only a few of us were born with psychic powers, this action may prove difficult. That is where the beautiful minds at Google come in.
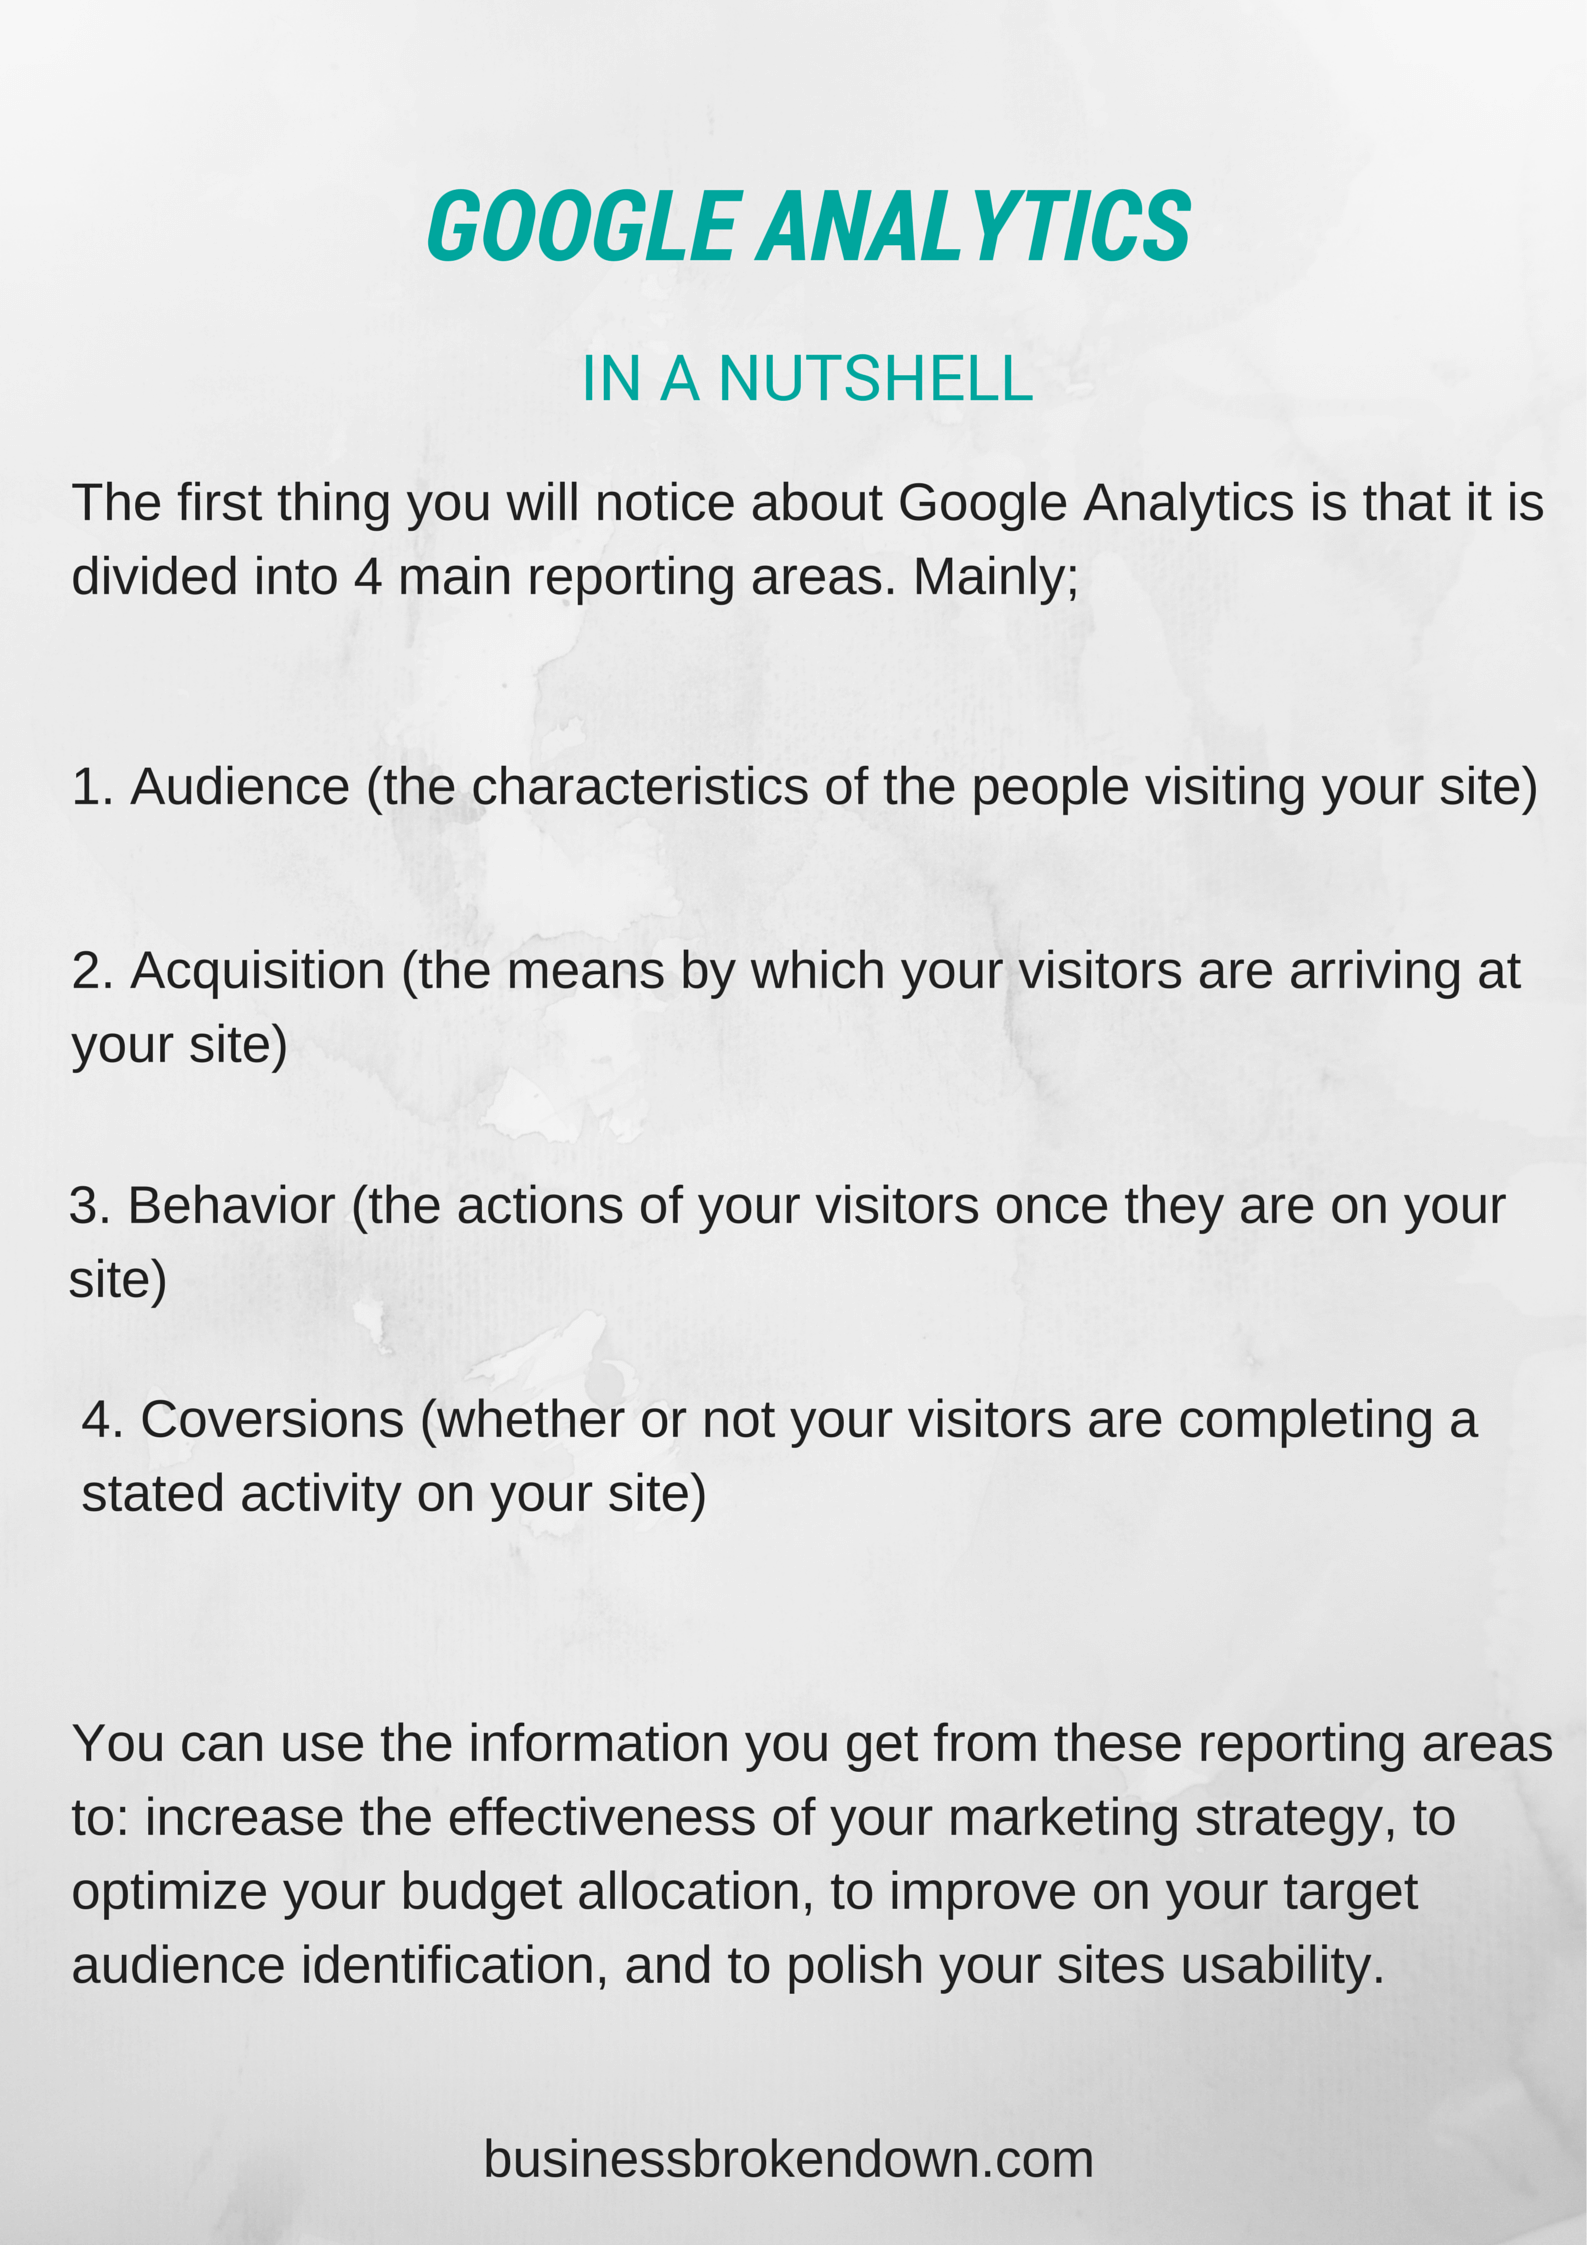
Google has given us Google Analytics, which is a service by which we can track and analyze data originating from our site. With Google Analytics we can delve deep into the brain of our audience (in a non-creepy way), in an effort to understand their behavior. This Analytics service provides traditional statistics and extensive reports on audience actions, so that you can reach out to your audience and drive more traffic to your site.
While the talk of statistics and reports might seem mind-numbing, the Google Analytics interface is simple and easy to use (Once you set up your Google Analytics account, and then install and activate the Google Analytics plug-in, you can get started with this service.)
The post below will not be about the basics of Google Analytics as that has been done several times. Instead, this post will look at how you can use Google Analytics to grow your business so that you can realize a wider customer base and increased revenue.
STEP 1: Find out where your visitors enter your site
Knowing what drives people to your site is incredibly helpful. By identifying your top landing pages, you can see which posts and topics are most interesting to your visitors.
In this way you can create similar posts and topics to draw more of your target customers to your site.
Additionally, you can use Acquisition reports to identify where new visitors are coming from. This could be from social media, forums, paid adverts, and links to name a few channels. Once you identify how new visitors are learning about your site, you can gear your promotion towards these channels in order to drive more traffic.
To do this go to:
Behavior> Behavior Flow> Site Content> Exit Pages and
Audience> All Traffic> Channels
STEP 2: Find out where your visitors leave your site
Just as it is important to find out where your visitors enter your site, it is equally as important to find out where your visitors leave your site. So why exactly would you do this? When someone leaves your site, it is almost always an indication of their disinterest in a particular piece of content.
By finding out which page your visitor was looking at before they left your site completely, you can take steps to improve your content or scrap it entirely.
Once you have made the necessary changes to your top exit pages, you can now keep your customers interested in your content for longer periods. This will in turn lead into a lower bounce rate (the proportion of visitors who exit from your site without visiting a second, third, or fourth page), which is a positive sign for your business.

As you can see, I need to work on reducing my bounce rate.
To do this go to:
Behavior> Behavior Flow> Site Content> Exit Pages
STEP 3: Identify your visitors device
When your customer visits your site, they will be using a mobile phone, tablet, or PC.
A few months ago Google instituted algorithm changes that shut out sites that were not mobile responsive. If a majority of your visitors came through their mobile phones, yet your site was not mobile responsive, you were royally screwed when the deadline hit.
By knowing your visitors devices you can tailor your posts to make them easy to read on a particular device. E.g. Big files take long to load on a mobile phone, and will therefore put off your mobile audience. Knowing this you should compress images and video for your visitors convenience.
To do this go to:
Audience> Mobile> Overview
STEP 4: Track your visitors actions through your page
In an ideal world, visitors would see your advert, visit your site, and then buy your product. Unfortunately, the visitor to customer conversion is not always this perfect.
Think about how you buy products online; you probably see an ad, bookmark it, visit the site 2 days later, exit the site, see the same ad a week later, return to the site, and then make your final purchase.
It is therefore important for you to track the movements of your visitors so that you can quickly identify the top conversion paths (the route between a visitor’s first interaction with your site and their final conversion).
Once you know which is the most effective conversion route your visitor takes, you can tailor your marketing strategy to that route. E.g. If your top conversion path is through paid display ads, then increase the quantity of your ads. Alternatively, if your top conversion path is through direct organic search, increase your SEO endeavors.
To do this go to:
Conversions> Goals> Goal Flow
STEP 5: Track visitors through your goal funnels
When you set up your Google Analytics account, you need to set up goals. These goals could include your visitor creating an account, playing a video, downloading a document, making a reservation, making an appointment, making an inquiry, and making a purchase.
Once you set these goals you should assign them a monetary value, so that you can determine how much revenue you are losing when your visitors are not completing a goal.
With this information you can now optimize your goal funnel so that goal completion and revenue can be increased. You can do this by adding steps, removing redundant steps, including simple explanations, and changing the funnel itself. In this way you can reduce the number of your visitors who exit your funnel midway.
To do this go to:
Admin> All Website Data> Goals> New Goal and
Conversions> Goals> Funnel Visualization
STEP 6: Learn your customers behavior
As I mentioned earlier, Google Analytics is about getting into the mindset of your customer. You can do this through looking at bounce rate, session duration, and site search. A low bounce rate signifies a great impression, while a high bounce rate signifies dissatisfaction. To remedy this you will need to reorganize your site in an effort to prompt your visitors to explore other areas of your site.
Also check on how long people are spending on particular pages, as this will give you an indication of how a page is performing. If people are spending only a few seconds on a page, you might need to redesign the content or add images. Remember that with the saturation of information on the internet your content needs to stand out.
Lastly, enable site search on your analytics account. By doing this you can identify the keywords your visitors type into the search box on your site. This allows you to know what they are looking for, what they are having trouble finding, and what information they are interested in. Use this information to redesign your site for easy navigation, and to craft your new content around your visitors interests.
To do this go to:
Behavior> Site Content> All Pages and
Behavior> Site Search> Search Terms
STEP 7: Find the demographics of your visitors
You need to know who your visitors are, and you can do this by finding out their age, gender, location, and interests. Once you know who your visitor is, you can tailor your site and content to meet their needs.
This information will also come in handy when advertising; targeted advertisements are more effective than general advertisements.

To do this go to:
Audience> Demographics/Interests/Geo
STEP 8: Identify shifts in traffic patterns over time
While your main focus with your business is your current traffic, you should always pay close attention to previous traffic as well. When you compare the two, you will come up with historical traffic trends that can direct your marketing strategies.
By seeing how traffic to your site has changed over time, you can learn more about how your customers behavior has changed over the last month or year.

To do this go to:
The date box at the top of your GA page> Tick the ‘compare to previous period’ box> Insert the periods that you want to compare
STEP 9: Identify sudden and unusual shifts in traffic patterns
It is always important to keep an eye on your daily traffic patterns. While it is highly improbable that you will bare witness to sudden shifts in traffic patterns, there is always a chance that this may occur. It is therefore important that you create Intelligence Events.
Intelligence Events alert you to huge spikes/drops in daily traffic, as well as anomalies and deviations in your normal traffic patterns. E.G. A 150% spike in traffic is a huge deviation from the norm. By setting an Intelligence Event you will be notified as soon as this unusual activity takes place.
What if another site linked to a page on your site and this lead to a huge spike in traffic for that page, but it did not reflect in the overall number of sessions for your entire site? You will probably not notice the anomaly that happened on one of your pages, and you can therefore not capitalize on that spike in traffic.
To set the conditions for your intelligence events go to:
Intelligence Events> Overview> Custom Alerts> Manage Custom Alerts
STEP 10: Add annotations to your reports
I currently use the annotation feature to indicate any paid ads, new strategies, and new posts that I may have executed. By annotating your Google Analytics data, you can have clear explanations for any changes in traffic and user behavior.
E.g. If you were part of an expert roundup that was published on Monday, and on Tuesday your traffic spiked, you know the cause for that spike. Alternatively, if your website crashed, and the next few days showed a slump in traffic, you know the reason behind this.
Additionally, if there is more than one person with access to your Google Analytics account, then annotations are a way to communicate- give them a heads up on what new actions you have taken.

To add annotations go to:
The downward arrow on your GA graphs> Create new annotation
STEP 11: Connect your Google Analytics Account to Google Webmaster Tools Account
Last but not least, you need to connect your GA account to your Webmaster Tools Account. By doing this you have access to a wealth of information, including your rankings for particular keywords, the queries on Google that bring up your site, how many impression clicks your site gets, and external links to your site.
With this information you can optimize your site for particular keywords so that you can witness an increase in organic traffic for your site. Webmaster tools also shows you the health of your site, in terms of crawl errors for your site, mobile usability errors with your site, and security issues with your site.
To do this go to:
Admin> Property Settings> All Products> Link Webmaster Tools
Final Verdict
As you can see, Google Analytics is a vital service for growing your business. By following the 11 steps given above, you can start realizing increased traffic and revenue for your business.
I hope you are not overwhelmed; these steps are super simple to implement and I am always on hand to help you out with your process (for a 25% fee )…just kidding..or am I?
Before you leave this page I urge you to leave a comment and tell me what you think. Also remember to share this with your friends, and subscribe to the VIP newsletter on the right of the screen.
Until next time, I hope you have a Happy Sunday and a great working week!

Very helpful, thank you very much.
LikeLike
Hi Ryan,
I am glad to hear that you found the post helpful. Stay tuned for new content, and don’t forget to subscribe to the newsletter.
Asante,
Davina
LikeLike
Wowl I needed this! Very helpful information. Google Analytics has been like Greek for me.
LikeLike
Hi Sandy,
I’m glad you found the post helpful. If you need any more help on GA, i’m open to help 🙂
Asante,
Davina
LikeLike